 capacity analysis")
Introduction
Differential Capacity Analysis (DCA) is a widely used method of characterizing State of Health (SoH) in secondary batteries through the identification of peaks that correspond to active material phase transformations. The degradation of Lithium-ion batteries is a complex process caused by a variety of mechanisms.
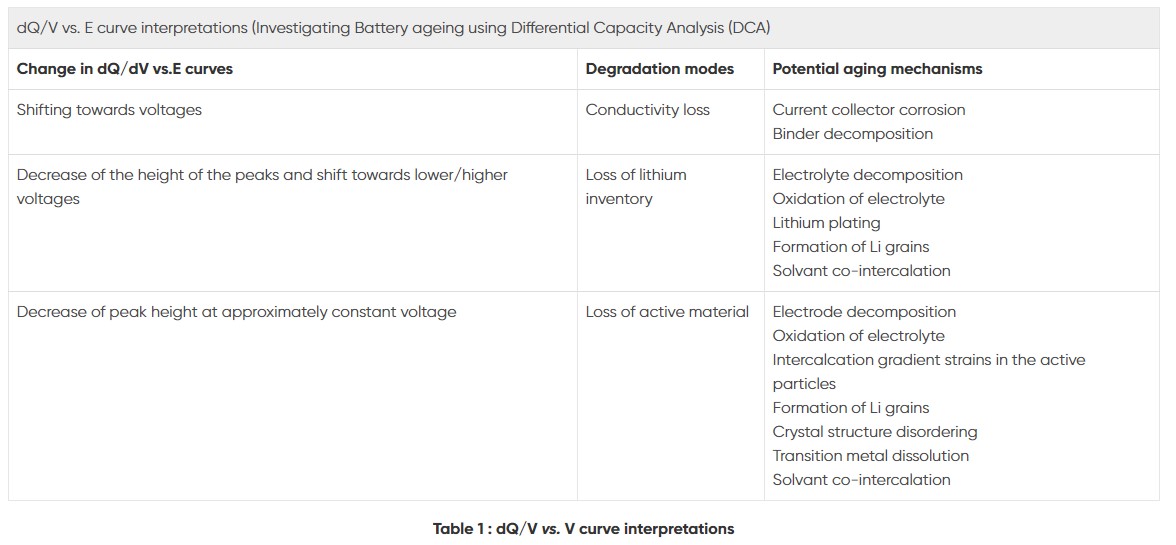
Ageing mechanisms can be grouped into three degradation modes: conductivity loss, loss of active material and loss of lithium inventory (LLI). Many studies have analyzed the effects of degradation modes using differential capacity analysis suggesting that they are suitable for the identification and quantification of the effects of the degradation mechanisms.
The main presentation of DCA curves used in the literature is dQ/dE vs. E. Such curves give information about the structural transformations during the charge/discharge process (Figure 1).
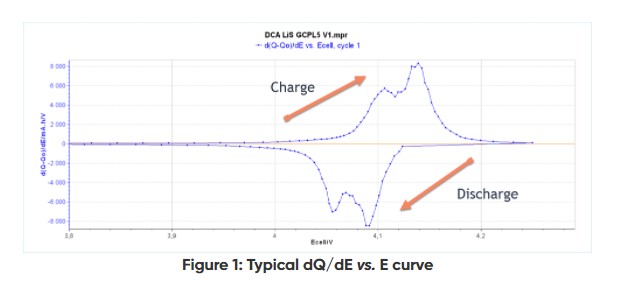
The advantage of the DC curve is that plateaus in the E vs. Q charge curve can appear as clearly identifiable peaks in the dQ/dE vs. E curve. These peaks are associated with phase transitions of the electrode material. The shape of the discharge and the charge curves give information about the reversibility of the electrode reaction. Plotting the differential capacity dQ/dE vs. cycle number allows the observation of any change (peak potentials, height, width, and area) in the peaks, from one cycle to the next, and can help detect degradation over long test cycles.
Degradations could be associated with side reactions involving electrolytes, active materials or non-active materials (current collectors, binders etc.). The evolution of the position and height of the peaks indicates the presence of different degradation mechanisms (Table 1).
EC-Lab® is equipped with two complementary tools to calculate dQ-Q0/dE. The first one is called DCA and can calculate with a constant dE sampling. The second one, Differential Capacity Spectroscopy, is able to make the calculation with a constant dt sampling. For both processes, the Advanced Option button allows the user to choose which dE should be used to calculate the derivative.
For more detailed information?
Please download the application note ‘Differential (Incremental) Capacity Analysis’ and ‘Differential Coulometry Spectroscopy’ and we will send you the full application note.