Introduction
For valid Electrochemical Impedance Spectroscopy (EIS) measurements, the system under investigation should be linear, stable, causal and stationary [1,2]. In this note, the term “stationarity” comprises steady-state and time-invariance. Steady-state is the state of a system after its transient state. For example, an R/C circuit submitted to a potential or current step is in a transient state and sees its response change until a certain amount of time has passed.
Time-variance refers to a system whose parameters defining its transfer function change with time. The chemical composition of a battery cell’s electrodes changes during charging or discharging, which affects its impedance. The two properties may be difficult to separate. EIS measurements during continuous charge or discharge, or in operando, are used to inspect a battery under operation [3-8]. The problem with such cases is understanding which impedance data can be considered valid, or moreover, for which frequencies, data should be considered erroneous because of the non-stationarity of the system.
In this application note, we will present various tools implemented in EC-lab to help check and correct the non-stationarity of the measurements. These tools will be applied to data obtained on a disscharging battery.
Experimental conditions
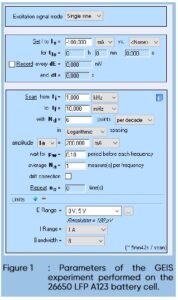
A 26650 LFP battery cell from A123 was used. A discharge of -100 mA during 130 s was performed followed by a Galvano-controlled EIS (GEIS) measurement with a DC current of -100 mA and an AC current modulation of -200mA at frequencies ranging from 1 kHz to 10 mHz with 6 points per frequency decade. Using a loop technique, the experiment, composed of a discharge followed by a GEIS, was performed nine times (Fig. 1)

Results
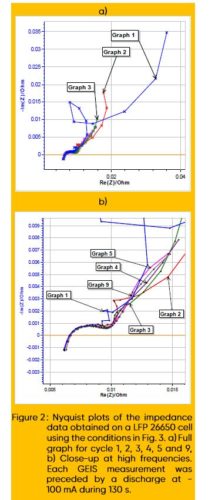
Figure 2 shows the successive impedance diagrams obtained on the batteries under discharge. Before each impedance measurement, the battery is discharged during 130 s at -100 mA. The impedance measurement is performed with galvanic control, hence there is no discontinuity between the discharge and the impedance measurement.
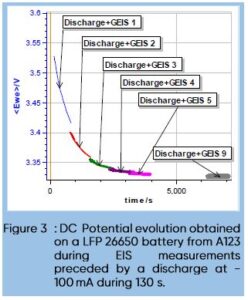
Figure 2a shows the totality of the chosen Nyquist diagrams (Cycle 1, 2, 3, 4, 5 and 9) and figure 2b is a close up on the high frequencies part. The first three diagrams are quite different and then the data seems to stabilize. Figure 3 shows the DC cell voltage evolution during the discharge and the impedance measurements for cycles 1 to 5, and 9.


We can see that the potential mostly decreases during the first three cycles and then starts to stabilize. The comparison of Figs. 2a and 3 shows that the unusual impedance values at low frequencies are due to the non-stationarity of the system, which is directly related to the DC current applied to the battery. It is quite difficult to interpret these data, and the peculiar shape of the impedance data at lower frequencies is not related to a specific electrochemical phenomenon but to the change of the systems parameters and a transient behavior. Contrarily to a corroding system, which, for example, sees its polarization resistance changes with time [9,10], the chemical changes occurring in a battery while its discharging are numerous and not easy to simulate and predict.
Learn More?
Please click on ‘Request Application Note’ and we will send you the full application note: ‘How to check and correct non-stationary EIS measurements’.
