Raman Spectroscopy and Imaging


What is Raman Spectroscopy?


Raman spectroscopy explained:
It is a technique for non-destructive microscopic chemical analysis, both qualitative and quantitative.


The Raman principle is a spectroscopic technique that measures the changes in the frequency of scattered light after interacting with a sample, providing information about the vibrations and rotations of molecules in that sample.


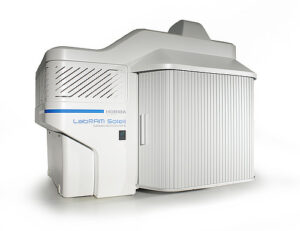
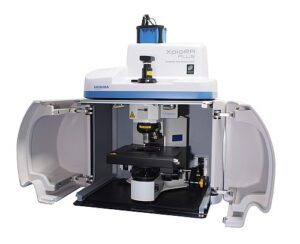
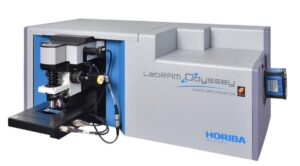
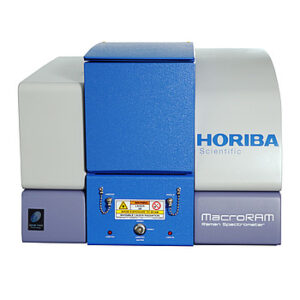
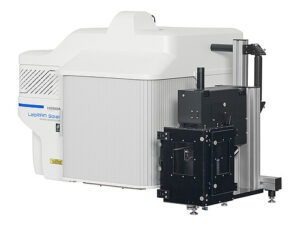
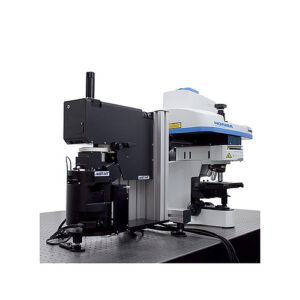
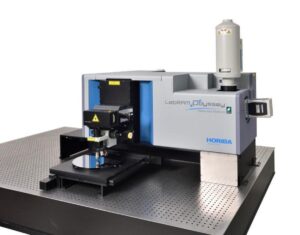
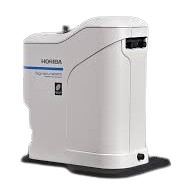
Our product range of spectroscopy equipment is characterized by high stability and reliability, high performance and speed (including patented Ultrafast Imaging functionalities) and time saving automation. Furthermore, combinations with other techniques are also available, such as Raman spectrometer combined with AFM technology to provide nanoscale measurements.


ST Instruments provides Raman spectrometers and other Raman Spectroscopy or Imaging solutions from HORIBA Scientific, a company that traces its history back to the major innovators of Raman instrumentation, such as the developers of the first Raman microscope, Professor Michel Delhaye and Edouard da Silva.

LabRAM Soleil | Raman Microscope

XploRA Plus | Raman Spectrometer – Confocal Raman Microscope

LabRAM Odyssey | Confocal Raman Microscope

MacroRAM | Affordable Benchtop Raman Spectrometer

LabRAM Soleil Nano | Real-time and Direct Correlative Nanoscopy

XploRA Nano | AFM-Raman for Physical and Chemical imaging


LabRAM Odyssey Nano | AFM-Raman for Physical and Chemical imaging


LabRAM Odyssey Semiconductor | Photoluminescence and Raman Wafer Imaging

SignatureSPM | Scanning Probe Microscope with Chemical Signature

How does Raman Spectroscopy work?

When monochromatic light interacts with particles much smaller than the radiation wavelength, nearly all photons are scattered in a fully elastic way, which means all of their kinetic energy is conserved. However, in a small fraction, some of the energy is lost due to the interaction with vibrational modes in the molecules which scatter the photons. This inelastic scattering is called Raman scattering, and these photons experience a red-shift (some energy is lost to the interacting matter) or a blue shift (some energy is transferred from the interacting matter to the photon). 

These shifts provide information on the vibrational modes of molecules in the material under investigation, such as chemical bonds or intramolecular bonds. The phase of the material also affects Raman scattering. The technique is non-destructive, and spectra can be collected from small volumes. Objects can be scanned globally to detect specific molecules in a field-of-view, or analyzed in detail by producing thousands of Raman spectra to map surface composition.

What does Raman Spectroscopy measure? It provides fingerprints of molecules or materials which allow rapid identification through databases.

Raman principle

Why use Raman Spectroscopy or Imaging?

The Raman scattering can reveal the composition of paint on an artwork, but will also help you to analyze samples of solids, powder, liquids or gas, e.g. for quality control. Raman spectroscopy can be integrated with several forms of microscopy, and even customized solutions are available. Intuitive software helps to analyze and interpret the data.

For increased sensitivity, Resonance Raman Spectroscopy can be used. In this enhancement technique, the frequency of the laser light is chosen to match the electronic transition levels in the sample, which increases the Raman scattering and thus improves the signal-to-noise ratio.

Raman spectroscopy is also used for mapping or imaging. This requires thousands of spectra to be taken, and it provides a detailed overview material concentration and distribution (peak height), but also of molecular structure and phase or material stresses/strains (peak position) or crystallinity (peak width). By using confocal Raman microscopy, the depth of a material can also be sampled.

If you are looking for a non-destructive technique for qualitative or quantitative high throughput chemical analysis, Raman Spectroscopy and Imaging is a very good choice.

Applications for Raman Spectroscopy and Imaging:

Geology

Natural rocks composing the Earth are complex. They consist of an aggregate of one or more minerals. Each mineral can be defined by its chemical composition and its crystalline structure and sometimes can also contain fluid inclusions. Geologists need a powerful characterization technique to get detailed information on the rock formation history. Raman spectroscopy is extremely information-rich (chemical identification, characterization of molecular structures, effects of bonding, environment and stress on a sample). With its non-destructive properties and high spatial resolution (< 1 μm), it is thus a tool of choice for geological studies.

Geology picture Raman Spectroscopy

Microplastics

Microplastics solutions for a better life

Researchers have found microplastics in marine and terrestrial life. It invades the food chain, and it’s even been found in salt, sugar, beer, alcohol, and honey. Not to mention glaciers and rainwater.

Microplastic characterization and identification

Raman spectroscopy plays a key role in identifying the types and origins of microplastics. It’s part of the efforts to develop policies and procedures for controlling the amount of microplastics introduced into our ecosystem. We look at the issues you face, and its effect on the biosphere and human health. 

HORIBA solutions are suitable for beginners as well as for the most demanding users and our expertise and knowledge provide support as you study microplastics.

Energy

Raman Spectroscopy Applied to the Lithium-ion Battery Analysis.


The Lithium-ion batteries (LIB) are of a great interest for many years as they are a rechargeable type of batteries, contrary to Lithium batteries. They are widely used in all kind of portable electronic devices or cordless tools, and they are used in newly developed electrical cars. As the need for power of all this devices is growing with their complexity, the performances of Li-ion batteries become an issue.


Today’s state of art of technology requires more reliable, more efficient and powerful energy sources. Lithium-ion batteries are thus of high inte­rest.

Raman spectroscopy adapts to the different stages of life of these batteries, such as the characterisation of new materials for more flexible systems, failure analysis; but also more standard analysis of used mate­rial during charge/discharge process, including structural and electronic properties, and even robust, automated QC tests.

Energy 2 picture for Raman Spectroscopy

Nanomaterials

The novel advanced material, graphene, first reported in Science in 2004, consists of single molecular layers of highly crystalline graphite. It is the basic structural element of some carbon allotropes, including graphite, carbon nanotubes and fullerenes.

It was isolated for the first time by a collaborative team from the Department of Physics, University of Manchester, UK, and the Institute for Microelectronics Technology, Chernogolovka, Russia.


Graphene exhibits excellent electron transport properties which make it a potential material for future nanoelectronic devices. Electronic mobilities in excess of 15,000 cm2V-1s-1 at room temperature have been reported. Its mechanical strength is excellent electron transport properties which make it a potential material for future nanoelectronic devices. An exciting field of development for this material is for a new generation of ultra-fast nanoscale transistors operating in the THz region. Due to its scale and optical properties, graphene is hardly visible on most substrates. However, distinguishing the number of graphene layers, as well as quantifying the impact of disorder on its properties is critical for the study of graphene-based devices.


Raman micro-spectroscopy has proven to be a convenient and reliable technique for determining both of these properties. The high structural selectivity of Raman spectroscopy, combined with both spectral and spatial resolution, as well as the non-destructive nature of this technique make it an ideal candidate as a standard characterization tool in the fast growing field of graphene.

Fig. Graphene Nanomaterials
Fig. Raman map Nanomaterials