
Introduction
A variety of experimental techniques can be used with batteries in order to study electrochemical reactions and battery behaviours.
The most traditional and direct technique consists of recording the evolution of the voltage and charge during successive charge/discharge cycles ideally by regularly increasing the current.
From this “cycling” protocol, we can extract a large number of key parameters for the characterization of an accumulator, such as capacity or coulombic efficiency. It is also possible to estimate their state of health by following polarization, hysteresis, and overvoltage phenomena. From the same data set, several representations of interest can be drawn providing complementary information.
The U/I vs. time curve makes it possible to clearly visualize the upper and lower voltage limits as well as the cycle time (Fig. 1). So, on one hand, with this time curve, all the cycles are identifiable and the charging/discharging stages generally have a symmetrical aspect if the processes are reversible.
On the other hand, for an identical current, a discharge time shorter than the charge time indicates low coulombic efficiency. At the end of the battery life, there is a decrease in battery charging and discharging times. Likewise, sudden variations in potential can be observed in the event of the appearance of micro-short circuits or component failures.
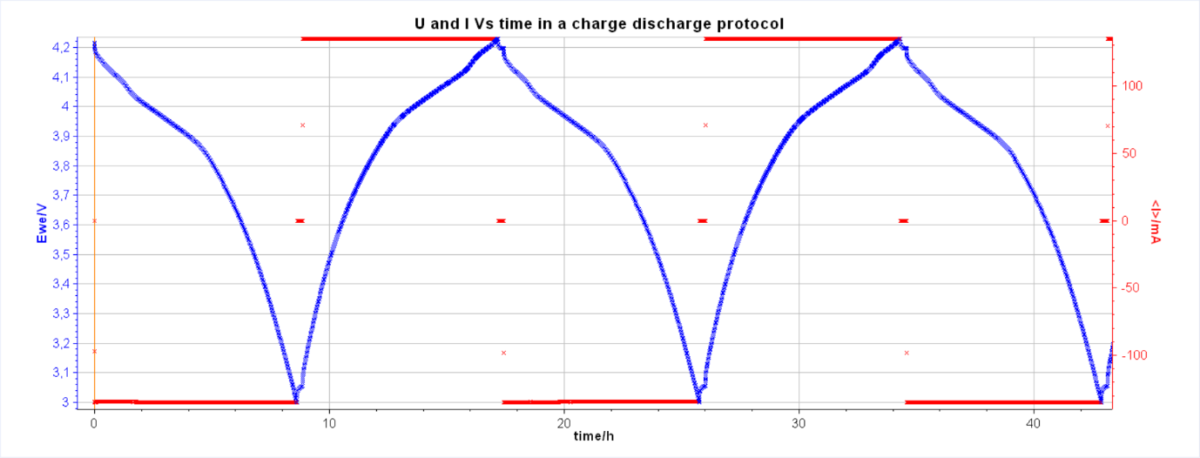
Fig. 1: A typical battery cycling time curve with the same C-rate.
At this point, we can either choose to study aging, using the representation of coulombic efficiency and capacity as a function of the cycles, or to isolate a particular cycle to study the insertion process in more detail.
Material Characterization
In order to observe electrochemical processes more closely, an E vs. Capacity representation, as shown in Fig. 2, of an isolated cycle, is frequently used as a good starting point.
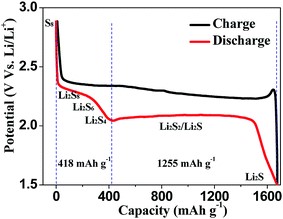
Figure 2: A typical individual charge/discharge cycle of a Lithium sulfurbattery electrode in E vs. Capacity, taken from JJ. Guo and J. Liu, Nanoscale Adv., 2019, 1, 2104 DOI: 10.1039/C9NA00040B, Published by The Royal Society of Chemistry
The E vs. Capacity curve makes it possible to identify the different phase changes involved in the charging and discharging processes as well as the associated capacities. This curve is complementary to differential capacity dQ/dE vs. E curve (Fig. 3). The advantage of the DC curve is that plateaus in the E vs. Q charge curve can appear as clearly identifiable peaks in the dQ/dE vs. E curve. These peaks are associated with electrode material phase transitions, if we consider a half-cell or a full cell with a third or the fourth electrode as a reference. The shape of the discharge and the charge curves give information about the reversibility of the electrode reaction. Plotting differential capacity dQ/dE (DCS/DCA) versus voltage allows the observation of any change (location, height, width, and area) in the peaks from one cycle to the next and can help detect degradation over long test cycles.
Learn More?
Please click on ‘Request Application Note’ and we will send you the full application note ‘How to read cycling curves’.