Background
Many analytical techniques can provide researchers with crucial insights into how our world works at the micro and nano scales. Since each technique has its own strengths, using many analytical techniques in concert can be an extremely effective approach. PiFM (photo-induced force microscopy) is one of the only imaging techniques that can provide direct chemical data with sub-5 nm resolution. Similarly, PiF-IR (photo-induced force infrared) spectroscopy is one of the only options for getting IR absorption spectra on monolayer materials. These specifications sound impressive on their own, but the real utility lies in an instrument’s ability to help people solve important scientific questions. A recent Nature Communications paper used a variety of techniques, named the micro-spectroscopy toolbox, to analyze polyolefin catalysts [1]. The goal was to explore the formation of polyethylene on a catalyst model that is more relevant to the industrial production of polyethylene. These data provide an excellent showcase of how different advanced nanoscale analytical tools can complement one another to efficiently study complex chemical systems.
The Model
The authors focused on polyolefin catalysts which, due to their hierarchically complex nature, are usually studied using a simplified planar model system whereas highly spherical catalyst particles are used industrially. To bridge the gap between the spherical catalysts and planar catalyst model, the authors introduce a spherical cap model that can be analyzed by all the techniques in their micro spectroscopy toolbox. The material discussed is a Ziegler-type catalyst spherical cap model which is based on a moisture-stable LaOCl framework designed to support a TiCl4 pre-active site. This is created to be as consistent as possible with the industrially relevant MgCl2 framework that is technically and experimentally limited due to high moisture sensitivity.
Therefore, the authors were inspired to design the LaOCl support matrix because it would provide strong SEM imaging contrast due to the high atomic weight of the lanthanide, and because of its stability in ambient conditions. The primary goal behind this new spherical cap model is to provide a system in which to study ethylene polymerization process ex-situ, but in a system more like the highly spherical industrial framework.
The toolbox
The micro-spectroscopy toolbox discussed consists of IR PiFM, PiF-IR, Raman microscopy, FIB-SEM-EDX, XPS, and ToF-SIMS. These techniques were all used to examine the interplay between the catalyst and the ethylene polymer phases formed after polymerization times ranging from 1 minute to 60 minutes. The authors were able to make several insightful observations using each of the tools in their toolbox.
Results comparison
Results from Raman
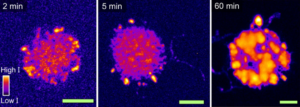
Besides PiFM and PiF-IR, Raman is the only other vibrational (and therefore chemical) analysis technique used. In this paper they used Raman microscopy to provide an efficient method of mapping the -CH stretching vibrations in the 2700–3100 cm−1 range. This will visualize the local thickness differences of the polyethylene formed in the spherical cap, but with a limited resolution of only 360 nm in the best-case scenario. Using Raman, the authors were able to determine that starting at the 2 min ethylene polymerization time, the formation of polyethylene can clearly be seen at both the center and edges of the spherical cap. However, the signals were stronger near the edges. At the longer polymerization times (5, 20 and 60 min) the trends seen with Raman microscopy were that the polyethylene layers grew more consistent across the spherical cap, and the layers grew to be thicker. Therefore, they conclude that polyethylene yields increased as a function of polymerization time.
Learn More?
Please click on ‘Request Application Note’ and download the full application note ‘Comparing Micro & Nano Spectroscopy Tools: Raman, PiFM, ToF-SIMS & SEM’.