


Localization, Characterization and Quality Control of Graphene and 2D Materials
[vc_row css_animation=”” row_type=”row” use_row_as_full_screen_section=”no” type=”full_width” angled_section=”no” text_align=”left” background_image_as_pattern=”without_pattern”][vc_column width=”2/3″][vc_column_text]
Localization, Characterization and Quality Control of Graphene and 2D Materials
Imaging Ellipsometry
[/vc_column_text][/vc_column][vc_column width=”1/3″][button size=”large” style=”white” icon=”” target=”_blank” font_weight=”500″ text_align=”center” text=”Download full application note” link=”https://www.stinstruments.com/wp-content/uploads/2018/02/PDF-Localization-Characterization-and-Quality-Control-of-Graphene-and-2D-Materials.pdf” background_color=”#eb6209″ border_radius=”6″][/vc_column][/vc_row][vc_row css_animation=”” row_type=”row” use_row_as_full_screen_section=”no” type=”full_width” angled_section=”no” text_align=”left” background_image_as_pattern=”without_pattern”][vc_column][vc_column_text]
In the research of 2D materials it is still challenging to find small flakes of 2D-materials with monolayer thickness. Conventional methods, e.g. optical microscopy work only with the use of contrast enhancing substrates. Imaging spectroscopic ellipsometry is applied to characterize graphene and other 2D materials with the benefit of combining the measurement quantities of ellipsometry with the lateral resolution of microscopy.
Spectroscopic Imaging Ellipsometry is a very powerful tool to characterize, analyse and investigate thicknesses, optical properties and defects or impurities of 2D-materials.
[/vc_column_text][/vc_column][/vc_row][vc_row css_animation=”” row_type=”row” use_row_as_full_screen_section=”no” type=”full_width” angled_section=”no” text_align=”left” background_image_as_pattern=”without_pattern”][vc_column width=”1/2″][vc_column_text]
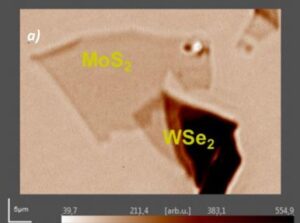
Fig 1. Ellipsometric contrast micrograph of A MoS2 | WSe2 hetero structure
[/vc_column_text][/vc_column][vc_column width=”1/2″][vc_column_text]
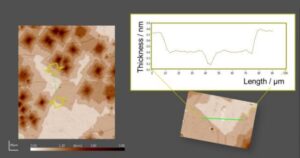
Fig 2. Thickness map of CVD-graphene on a SiO2 | Si substrate
[/vc_column_text][/vc_column][/vc_row]