


Fuel Cell Membrane Characterization
[vc_row css_animation=”” row_type=”row” use_row_as_full_screen_section=”no” type=”full_width” angled_section=”no” text_align=”left” background_image_as_pattern=”without_pattern”][vc_column width=”2/3″][vc_column_text]
Fuel Cell Membrane Characterization
Fuel cell membrane aging
[/vc_column_text][/vc_column][vc_column width=”1/3″][button size=”large” style=”white” target=”_self” hover_type=”default” font_weight=”500″ text_align=”center” text=”Request application note” link=”https://www.stinstruments.com/applications/energy/fuel-cell-membrane-characterization/request-application-note-fuel-cell-membrane-characterization/” background_color=”#eb6209″ border_radius=”6″][/vc_column][/vc_row][vc_row css_animation=”” row_type=”row” use_row_as_full_screen_section=”no” type=”full_width” angled_section=”no” text_align=”left” background_image_as_pattern=”without_pattern”][vc_column][vc_column_text]
Nafion based fuel cell membranes are multilayer structures with a permeation membrane and two thin layers of noble metal in a polymer matrix acting as the anode and the cathode of the fuel cell. Cross-sectional Fuel Cell Membrane Characterization is useful for studying mechanisms that impact lifetime and performance of the fuel cell. Shown below are XPS images from an aged fuel cell membrane that indicate the presence of fluorocarbon degradation products in the anode and cathode regions.
[/vc_column_text][/vc_column][/vc_row][vc_row css_animation=”” row_type=”row” use_row_as_full_screen_section=”no” type=”full_width” angled_section=”no” text_align=”left” background_image_as_pattern=”without_pattern”][vc_column width=”1/2″][vc_column_text]

Fig. 1: X-ray beam induced secondary electron image (SXI) of cross-sectioned fuel cell membrane
[/vc_column_text][/vc_column][vc_column width=”1/2″][vc_column_text]
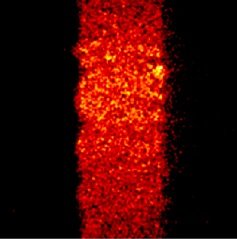
Fig. 2: Elemental image for fluorine (F 1s)
[/vc_column_text][/vc_column][/vc_row][vc_row css_animation=”” row_type=”row” use_row_as_full_screen_section=”no” type=”full_width” angled_section=”no” text_align=”left” background_image_as_pattern=”without_pattern”][vc_column width=”1/2″][vc_column_text]

Fig. 3: F 1s spectrum from the imaged area
[/vc_column_text][/vc_column][vc_column width=”1/2″][vc_column_text]

Fig. 4: Chemical state images for fluorine showing fluorocarbon chemistry in the center of the membrane and fluoride chemistry in the anode and cathode regions.
[/vc_column_text][/vc_column][/vc_row]